
Campaign Overview
In this article
See how your email and SMS campaigns are doing at a glance: the revenue they brought in, how many people they reached, and how engaged those people were, all against the period before.
Where to find it
Campaigns → Overview. The SMS cards appear when the client sent SMS campaigns in your date range.
Push and WhatsApp campaigns can be found on the Campaign Deep Dive tool.
What you see
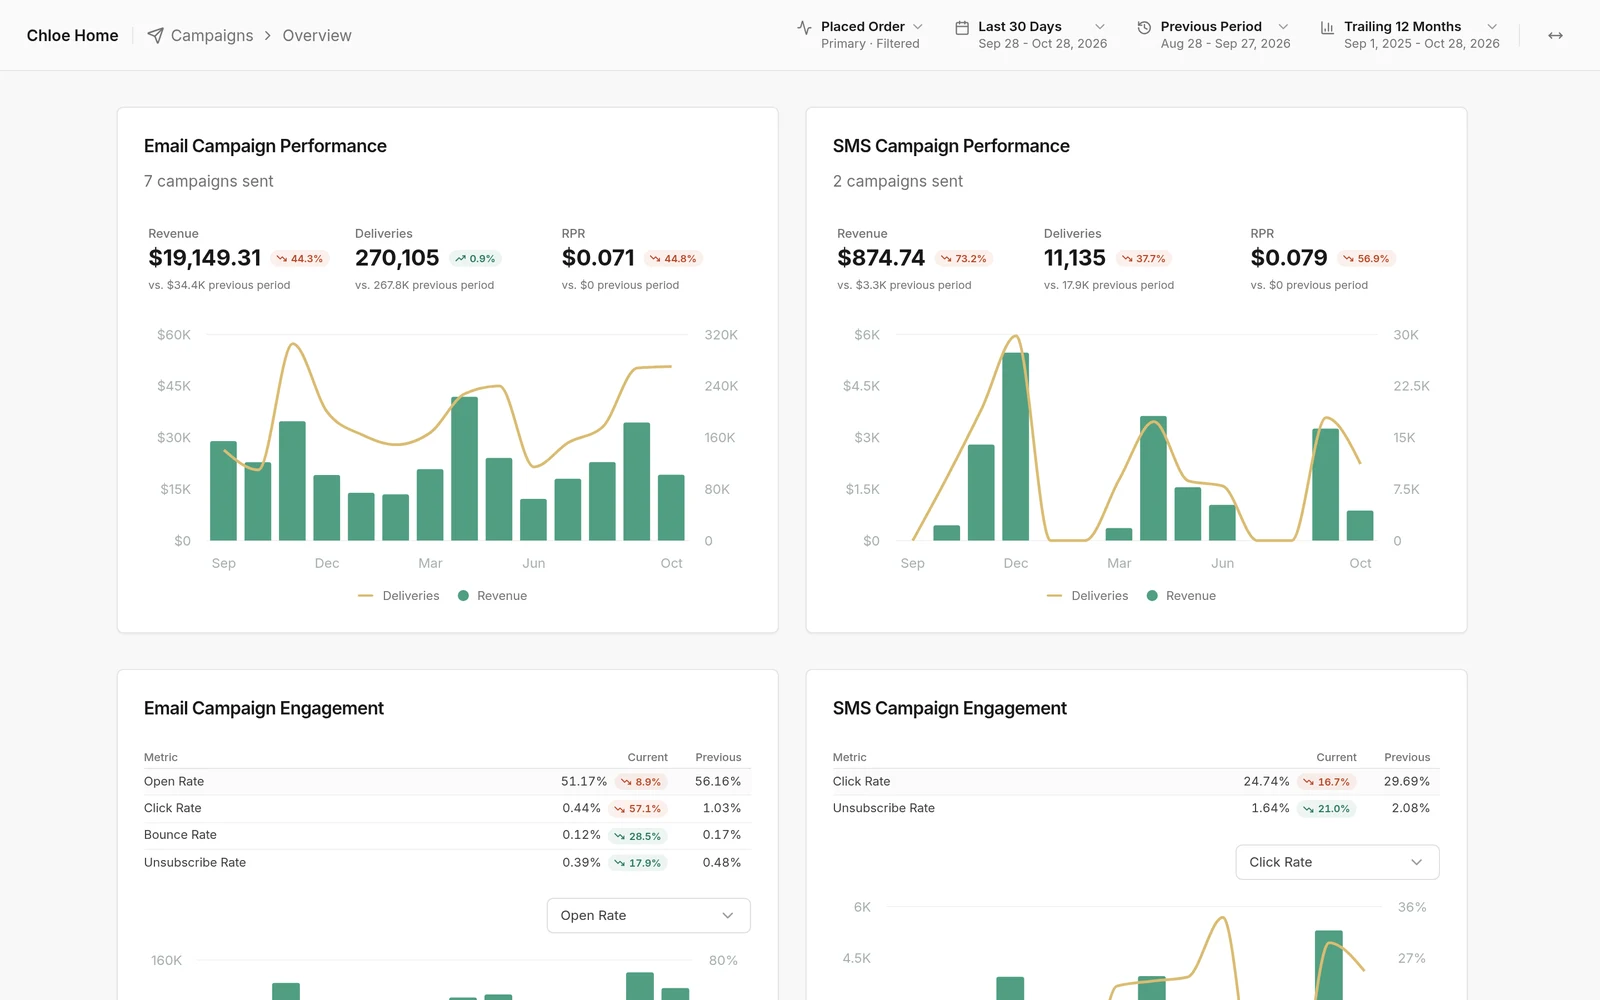
Email Campaign Performance and SMS Campaign Performance show how many campaigns went out in your date range, then three numbers, each with its change against the comparison period:
- Revenue: the revenue those campaigns drove, using your conversion metric.
- Deliveries: how many messages reached someone.
- RPR: revenue per recipient, revenue divided by deliveries.
Below them, a chart shows revenue (bars) and deliveries (line) over time, so you can see whether a change is a one-off or a trend.
Email Campaign Engagement and SMS Campaign Engagement list your open, click, bounce and unsubscribe rates for the current and previous period. Use the dropdown above each chart to choose which rate to plot over time, including conversion rate.
How to use the page controls
The four controls at the top of the page set what every card shows.

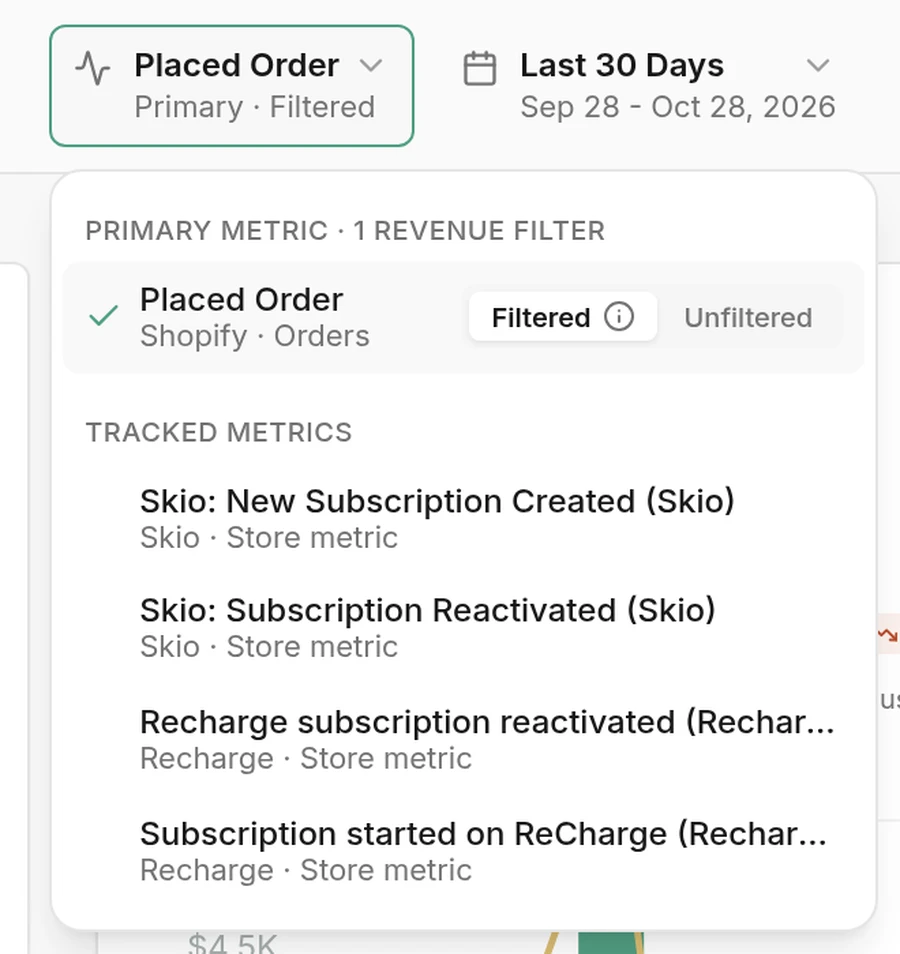
Conversion metric (Placed Order): which purchase event counts as revenue. If the client has revenue filters (for example, leaving out recurring subscription orders), pick Unfiltered to see revenue before them. You can switch it to any other metric you track, like a new subscription or a custom event. To track more metrics, go to Client settings → Conversion Metrics.
- Date range (Last 30 Days): the period the cards add up. Pick a preset like Last 90 Days or Last Month, or choose Custom date range and click two days on the calendar.
- Comparison (Previous Period): what the changes are measured against. Choose Previous Month, Previous Quarter, Previous Year, a Custom Comparison, or No Comparison.
- Over time charts (Trailing 12 Months): how far back the charts go. It's separate from the date range, so you can read last month's totals against a year of history.
How to change the chart's range and detail
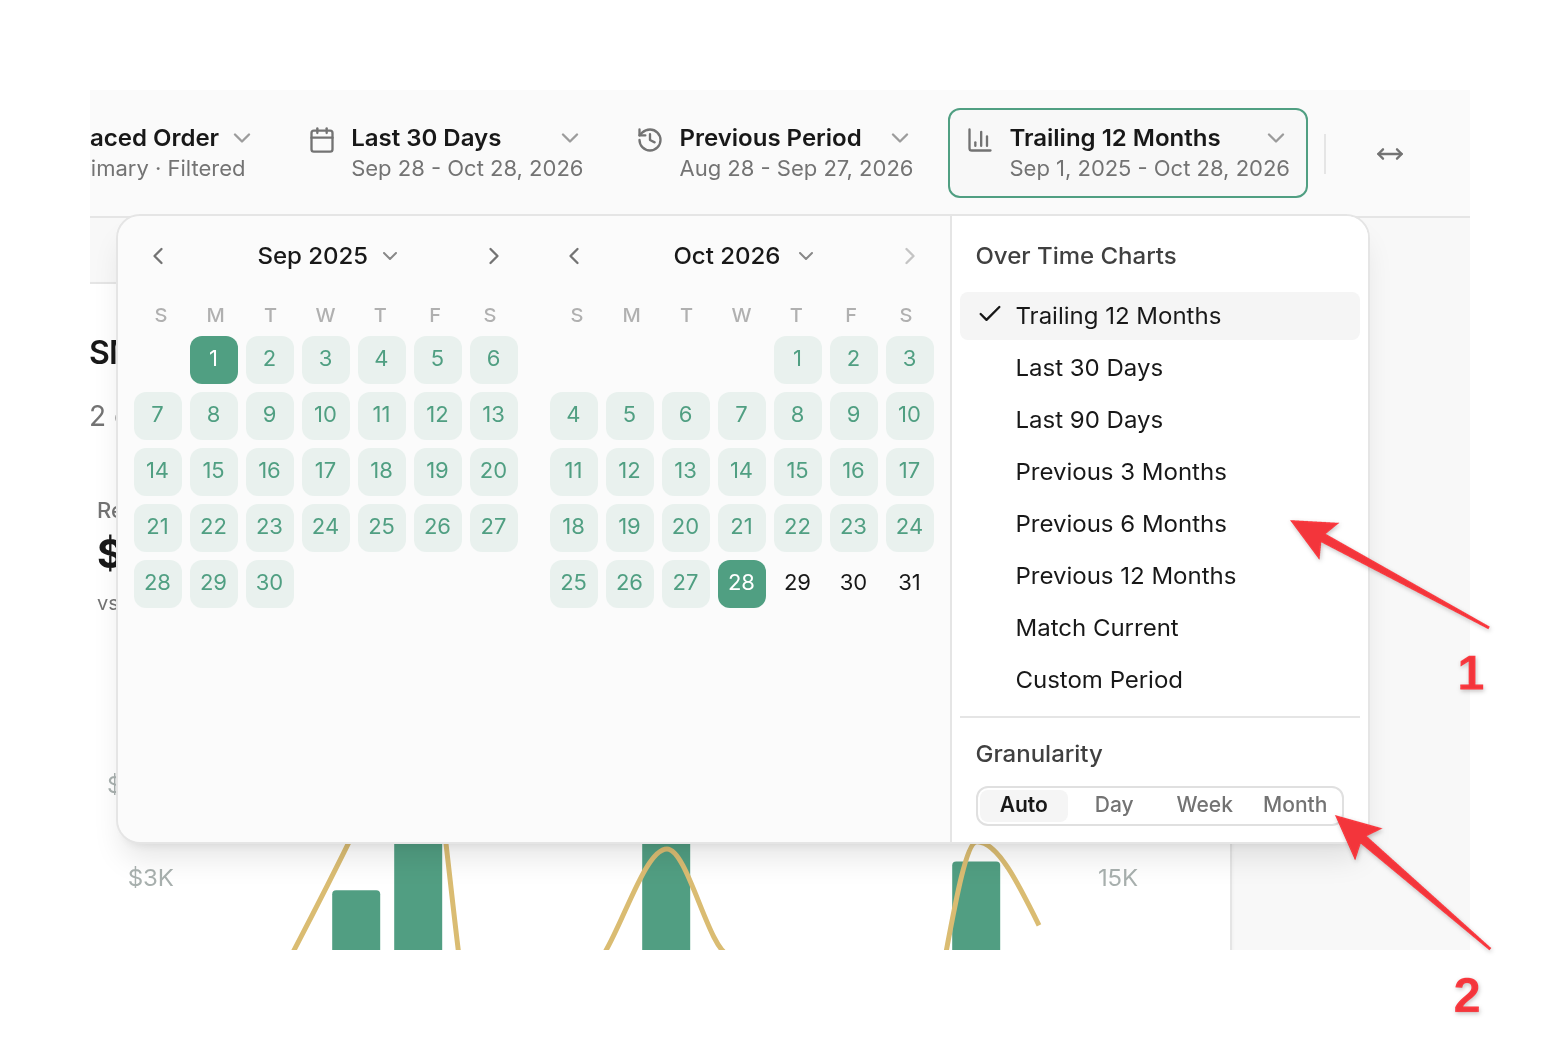
- Open the over-time control and pick a range: Last 90 Days, Previous 6 Months, Match Current (the same dates as your date range), or a Custom Period.
- Under Granularity, choose Day, Week or Month for each bar. Auto picks one that fits the range.
How to add campaign numbers to a client report or dashboard
The campaign performance slides
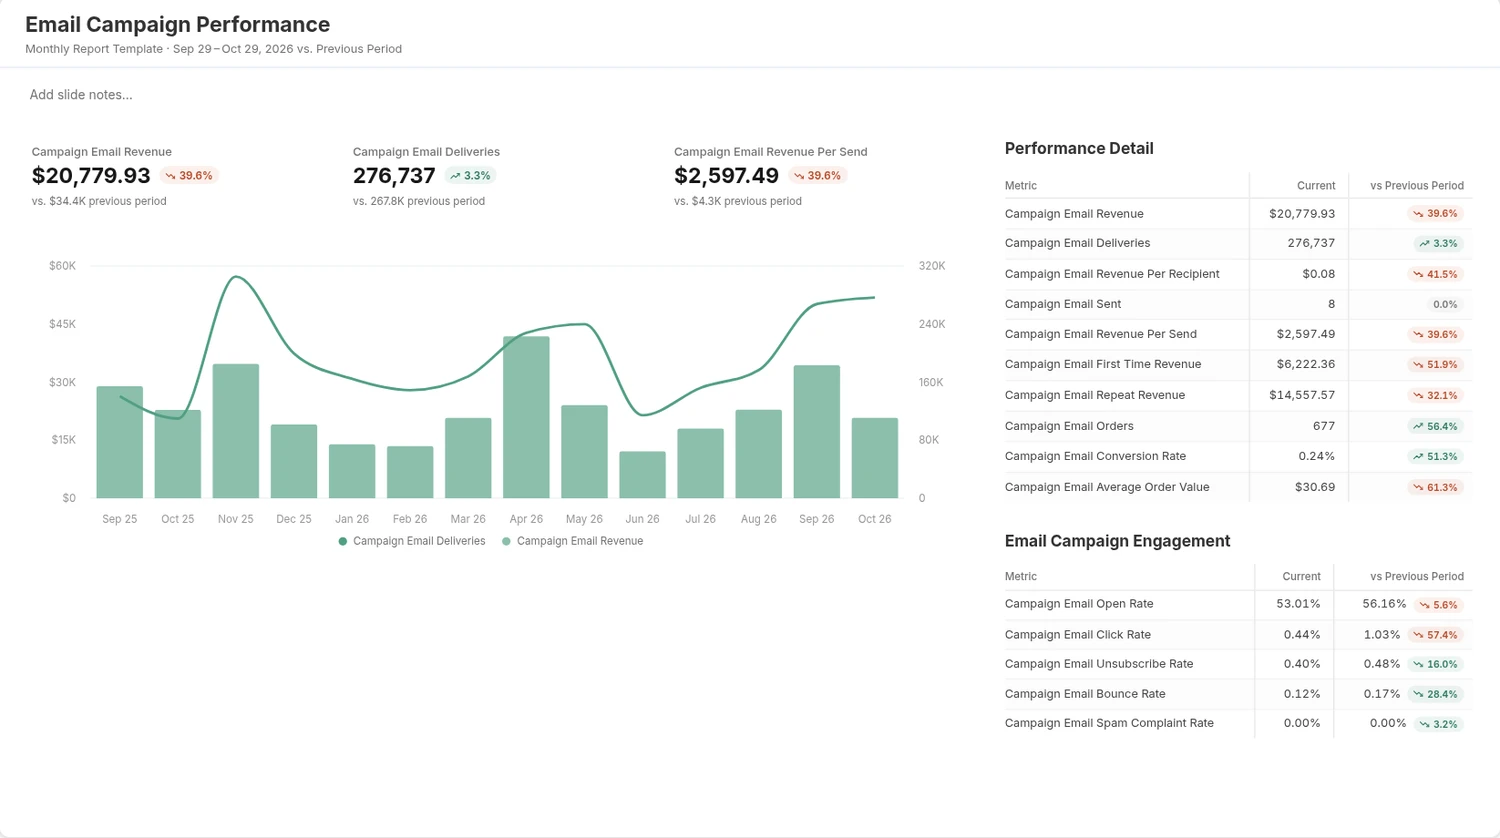
In Reporting → Report Generator, click + next to Slides, open Browse full library, and pick Email Campaign Performance (or SMS, Push or WhatsApp) under Campaigns. Each slide has the same revenue, deliveries and revenue per recipient as this page, a chart over time, and performance and engagement tables.
Build your own with the Campaign Table block
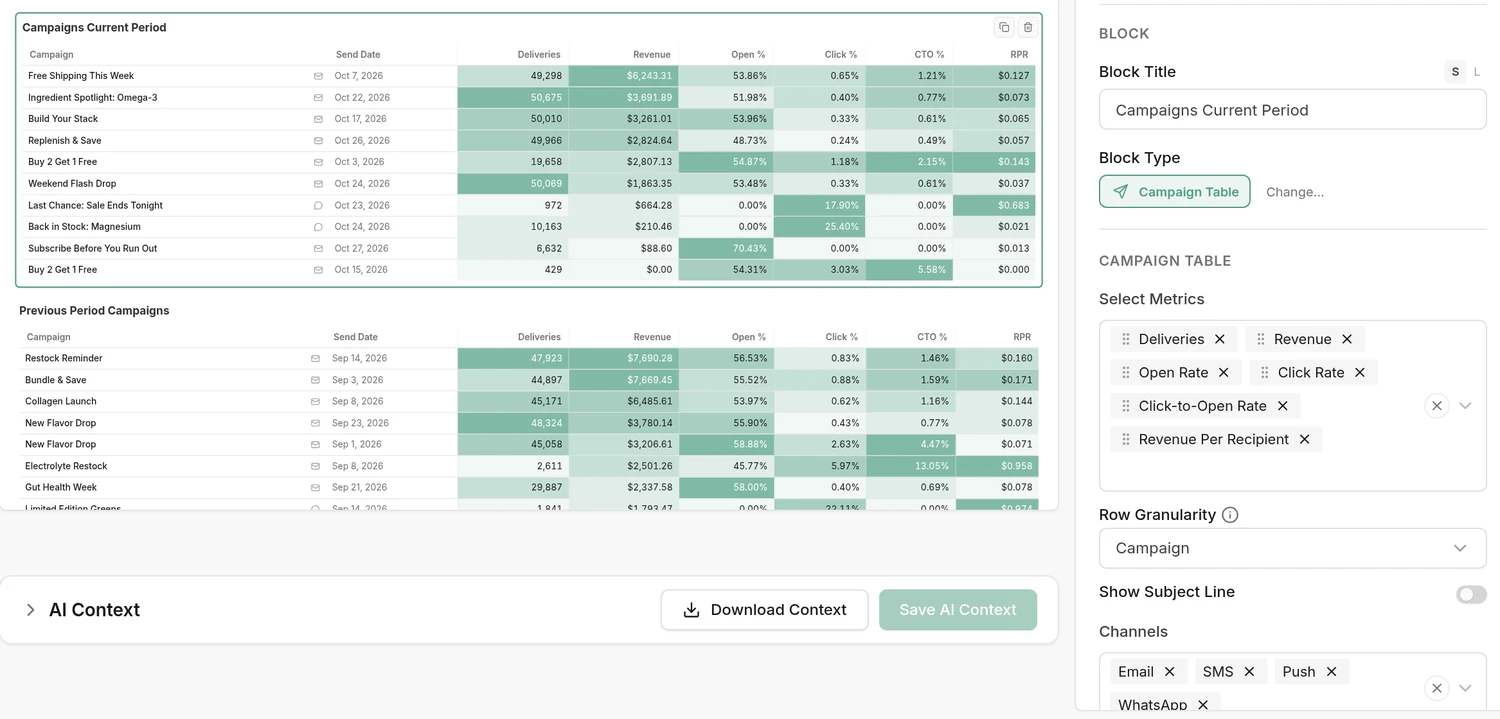
To list campaigns on any slide, click a block, and next to Block Type click Change... and pick Campaign Table. Choose the columns in Select Metrics, and narrow it by Channels or by keywords in the campaign names.
On the Custom Dashboard
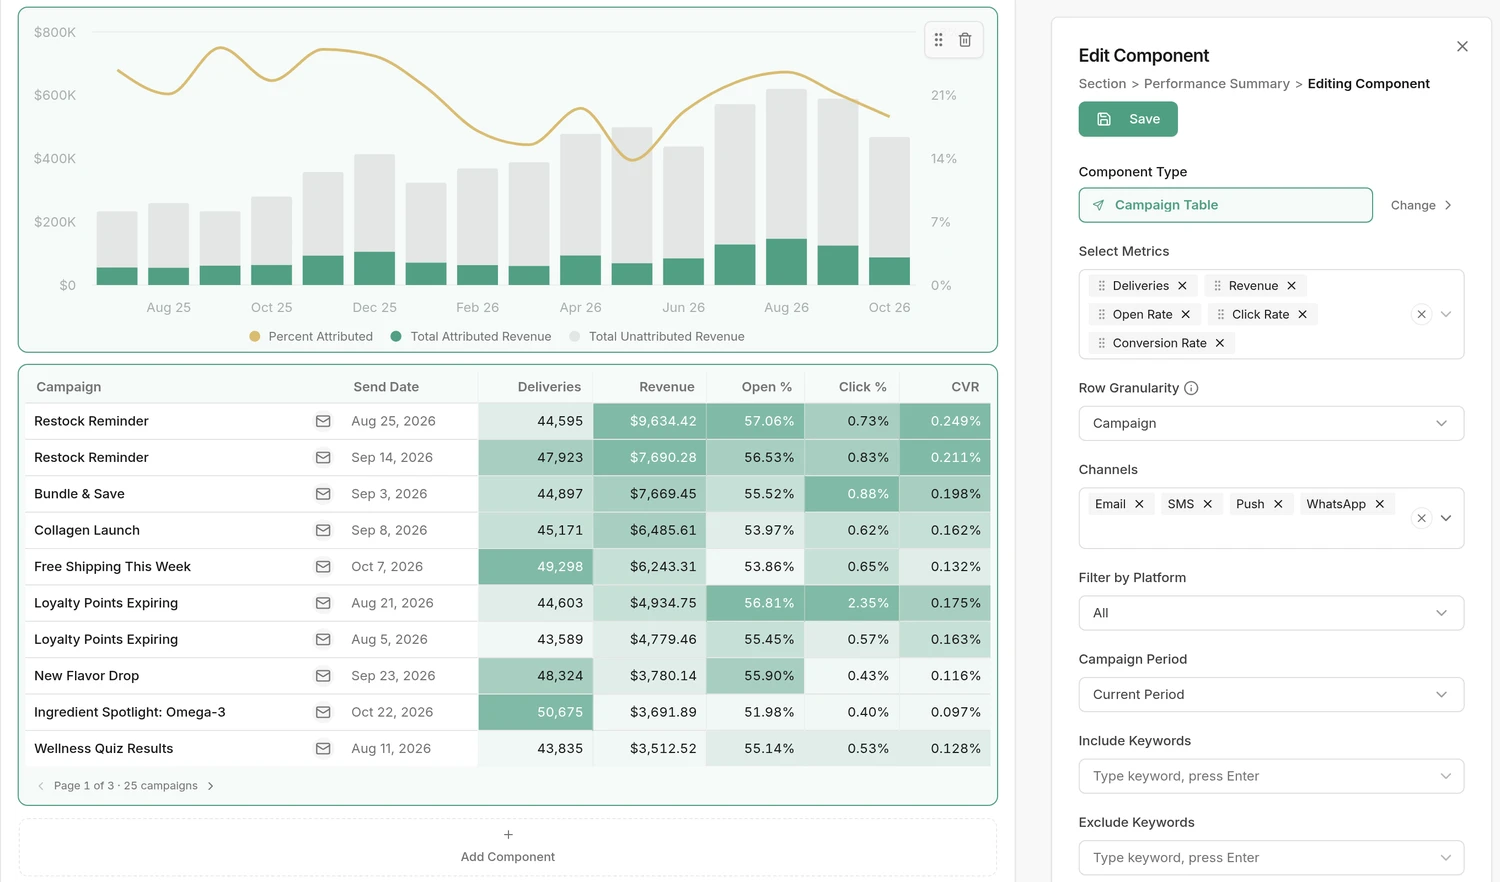
The Custom Dashboard has the same Campaign Table component. In Edit Mode, click Add Component and pick Campaign Table.
More about these numbers
- Revenue follows your attribution settings. Which conversions count, and for how long after a send, is set per client in Client settings → Attribution. Different settings are the most common reason Hiro and Klaviyo show different numbers (see Troubleshooting Data Discrepancies).
- Need one campaign at a time? Campaign Deep Dive lists every campaign with its own numbers.
Platform availability
- Klaviyo: everything on this page.
- Omnisend, Sendlane or ActiveCampaign: revenue is what the platform itself reports, so Hiro's attribution settings and conversion metric don't change it.
- Attentive or Postscript SMS: where the platform doesn't report deliveries, the SMS cards count recipients instead.