
Agency
In this article
See every client in your agency on one page: how much store and attributed revenue they made, who is ahead or behind on the month, and which campaigns did best across the agency. Save the views you check often so the right clients and columns are one click away.
Where to find it
Agency, in the menu. This view is only available for agency users.
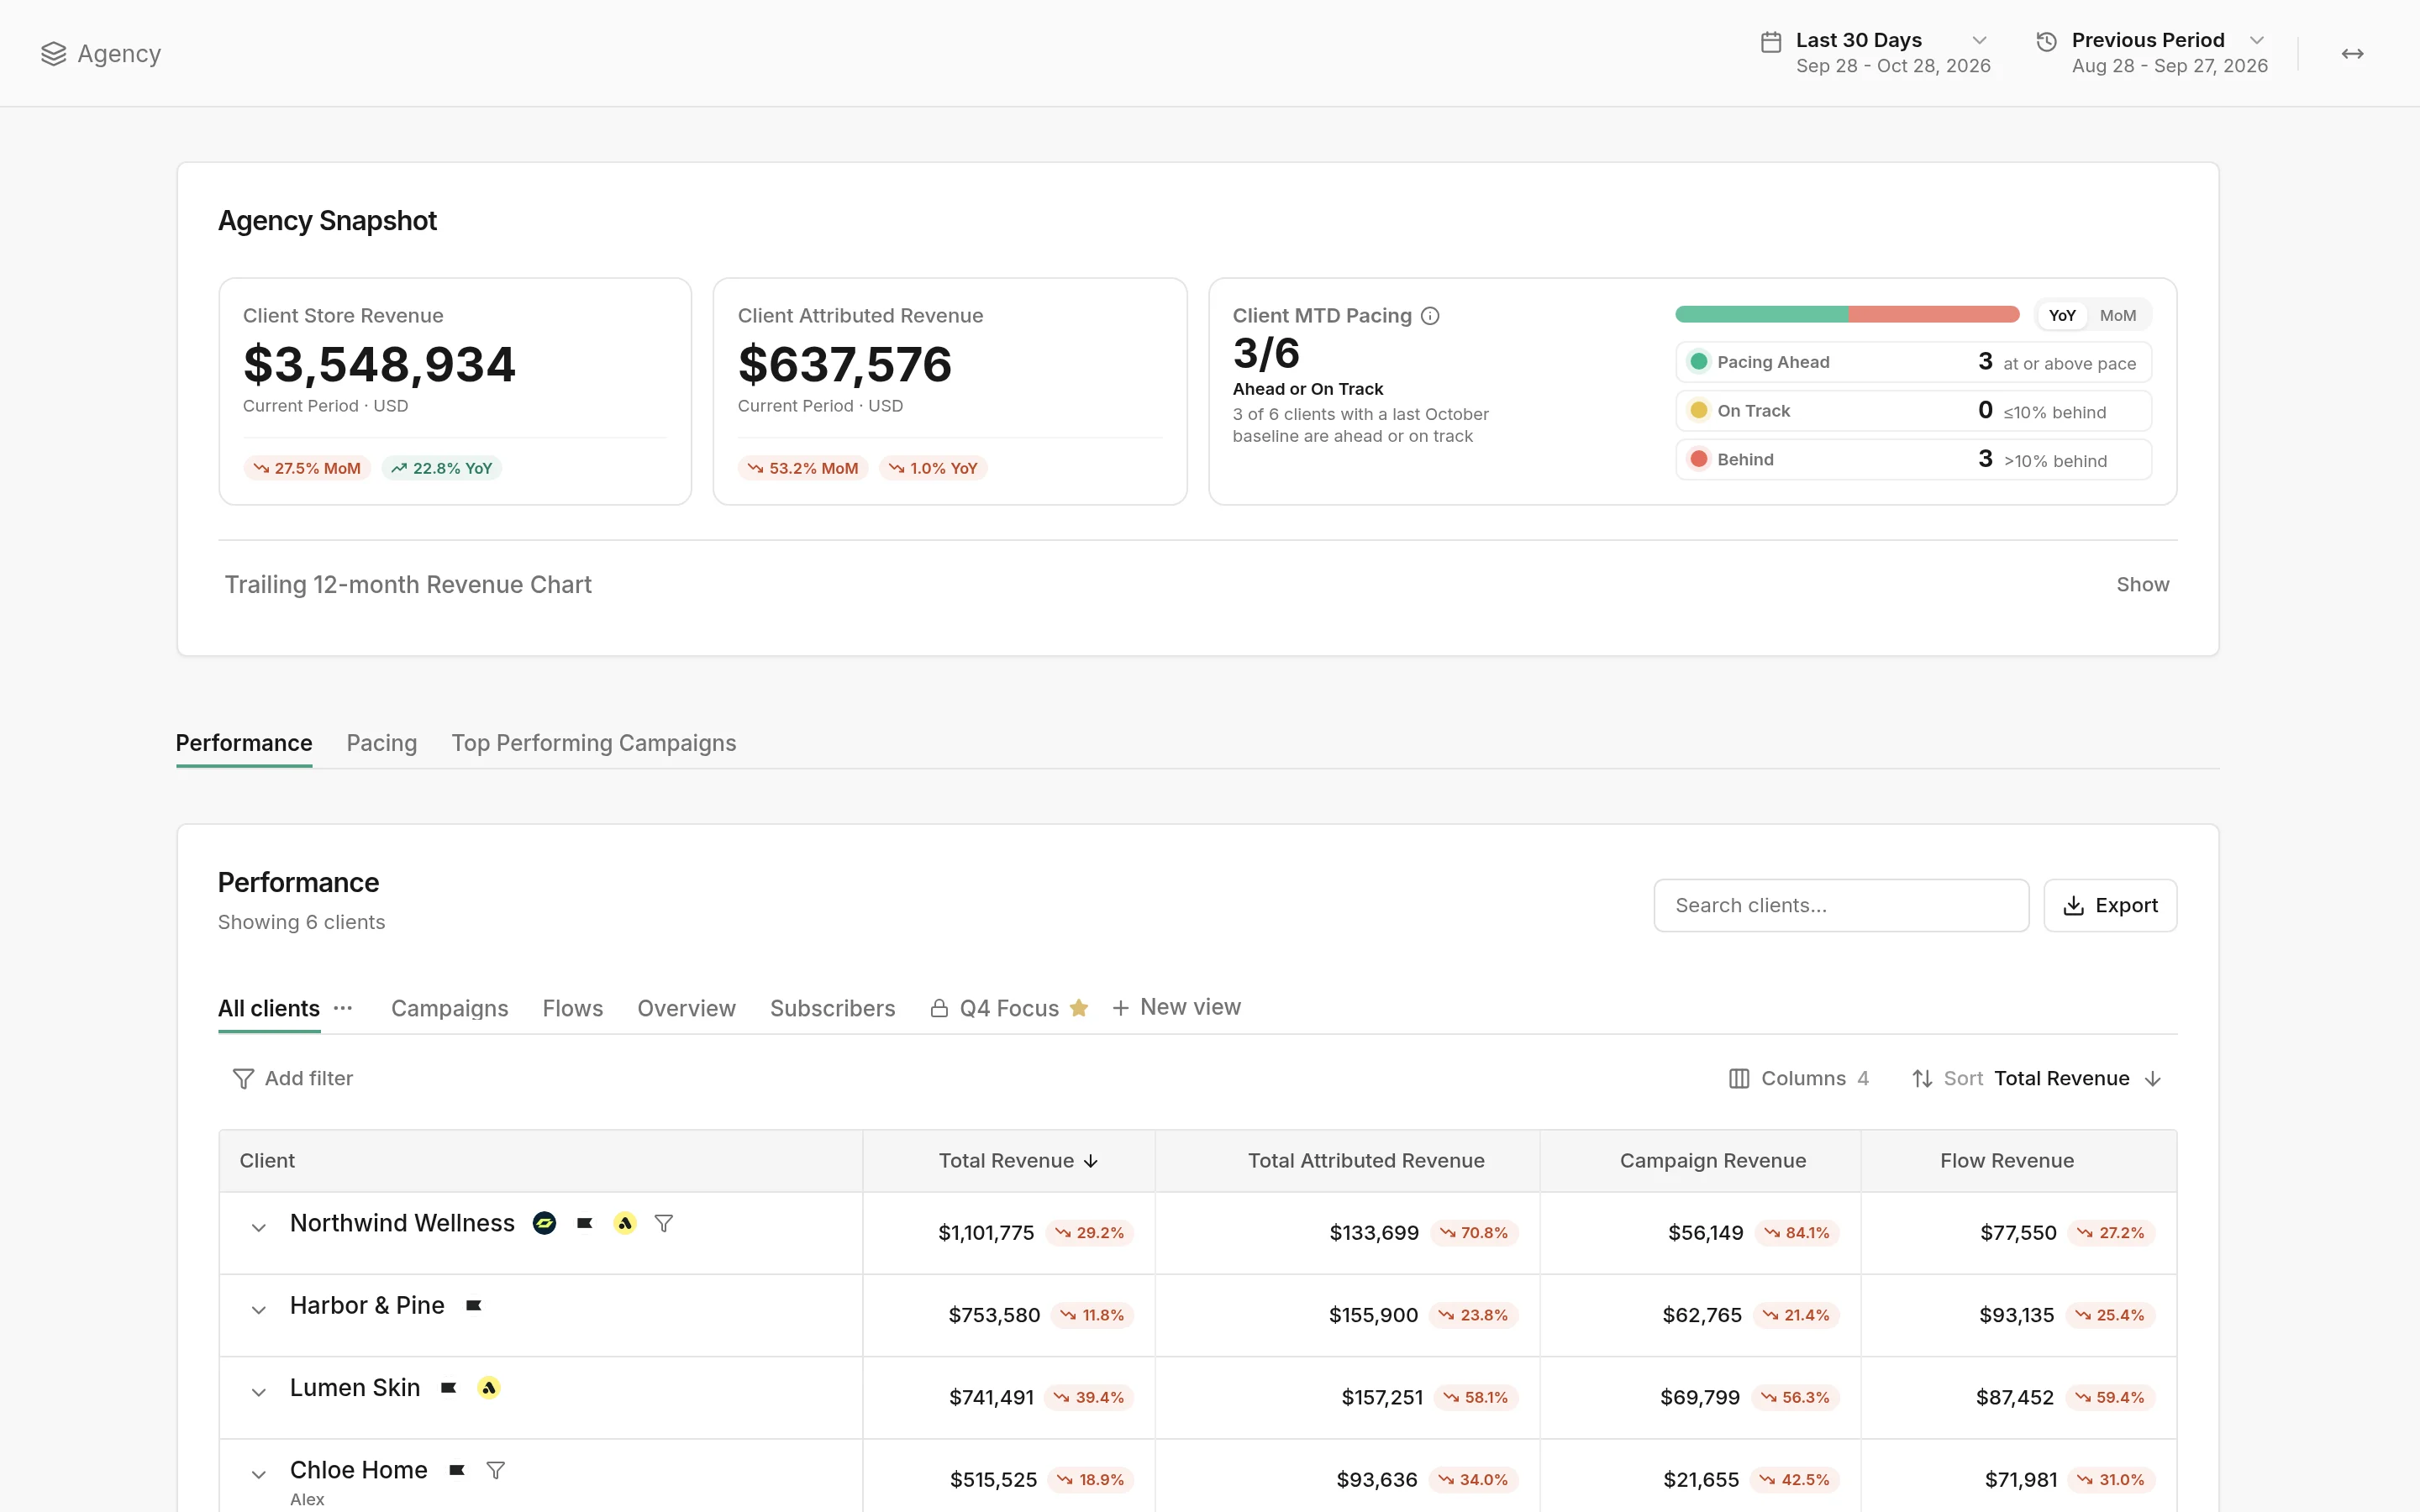
What you see
Agency Snapshot adds up all your clients for the date range:
Client Store Revenue and Client Attributed Revenue, with their change month on month and year on year.
Client MTD Pacing: how many clients are Pacing Ahead, On Track (up to 10% behind) or Behind (more than 10% behind) this month, against the same month last year (YoY) or last month (MoM).
Trailing 12-month Revenue Chart: click Show for the agency's revenue over the last year.
Below it are three tabs: Performance, Pacing and Top Performing Campaigns.
Performance
One row per client with the columns you choose, for the date range at the top of the page. A filter icon next to a client's name means it has revenue filters; hover over it to see which.
How to see one client's details
Click the arrow next to a client to open its row.
Client Snapshot shows that client's key numbers with their change. To choose which, click Edit fields, search for a field, tick it, and click Save. The fields are saved for that client, for everyone in your agency; Reset goes back to the default list.
MTD Pacing shows the client's month to date against the same day last year (Beat Last Year) and last month (Beat Last Month), and against your own goal once you set one (below).
To give a client a Manager, Tags or Notes, hover over its name and click the pencil. Managers and tags show under the client's name and work as filters in your views.
How to set a pacing goal
Each client's pacing compares this month with last year and last month. Add your own target to track it against that too.
On the Performance tab, click the arrow next to a client to open its row.
In MTD Pacing, click Set goal.
Type the client's attributed revenue goal for the month and click Save.
A Custom Goal card joins Beat Last Year and Beat Last Month: the month to date, where the goal says the client should be by today, and how far ahead or behind it is. Click Edit goal to change it.
How to set up a view
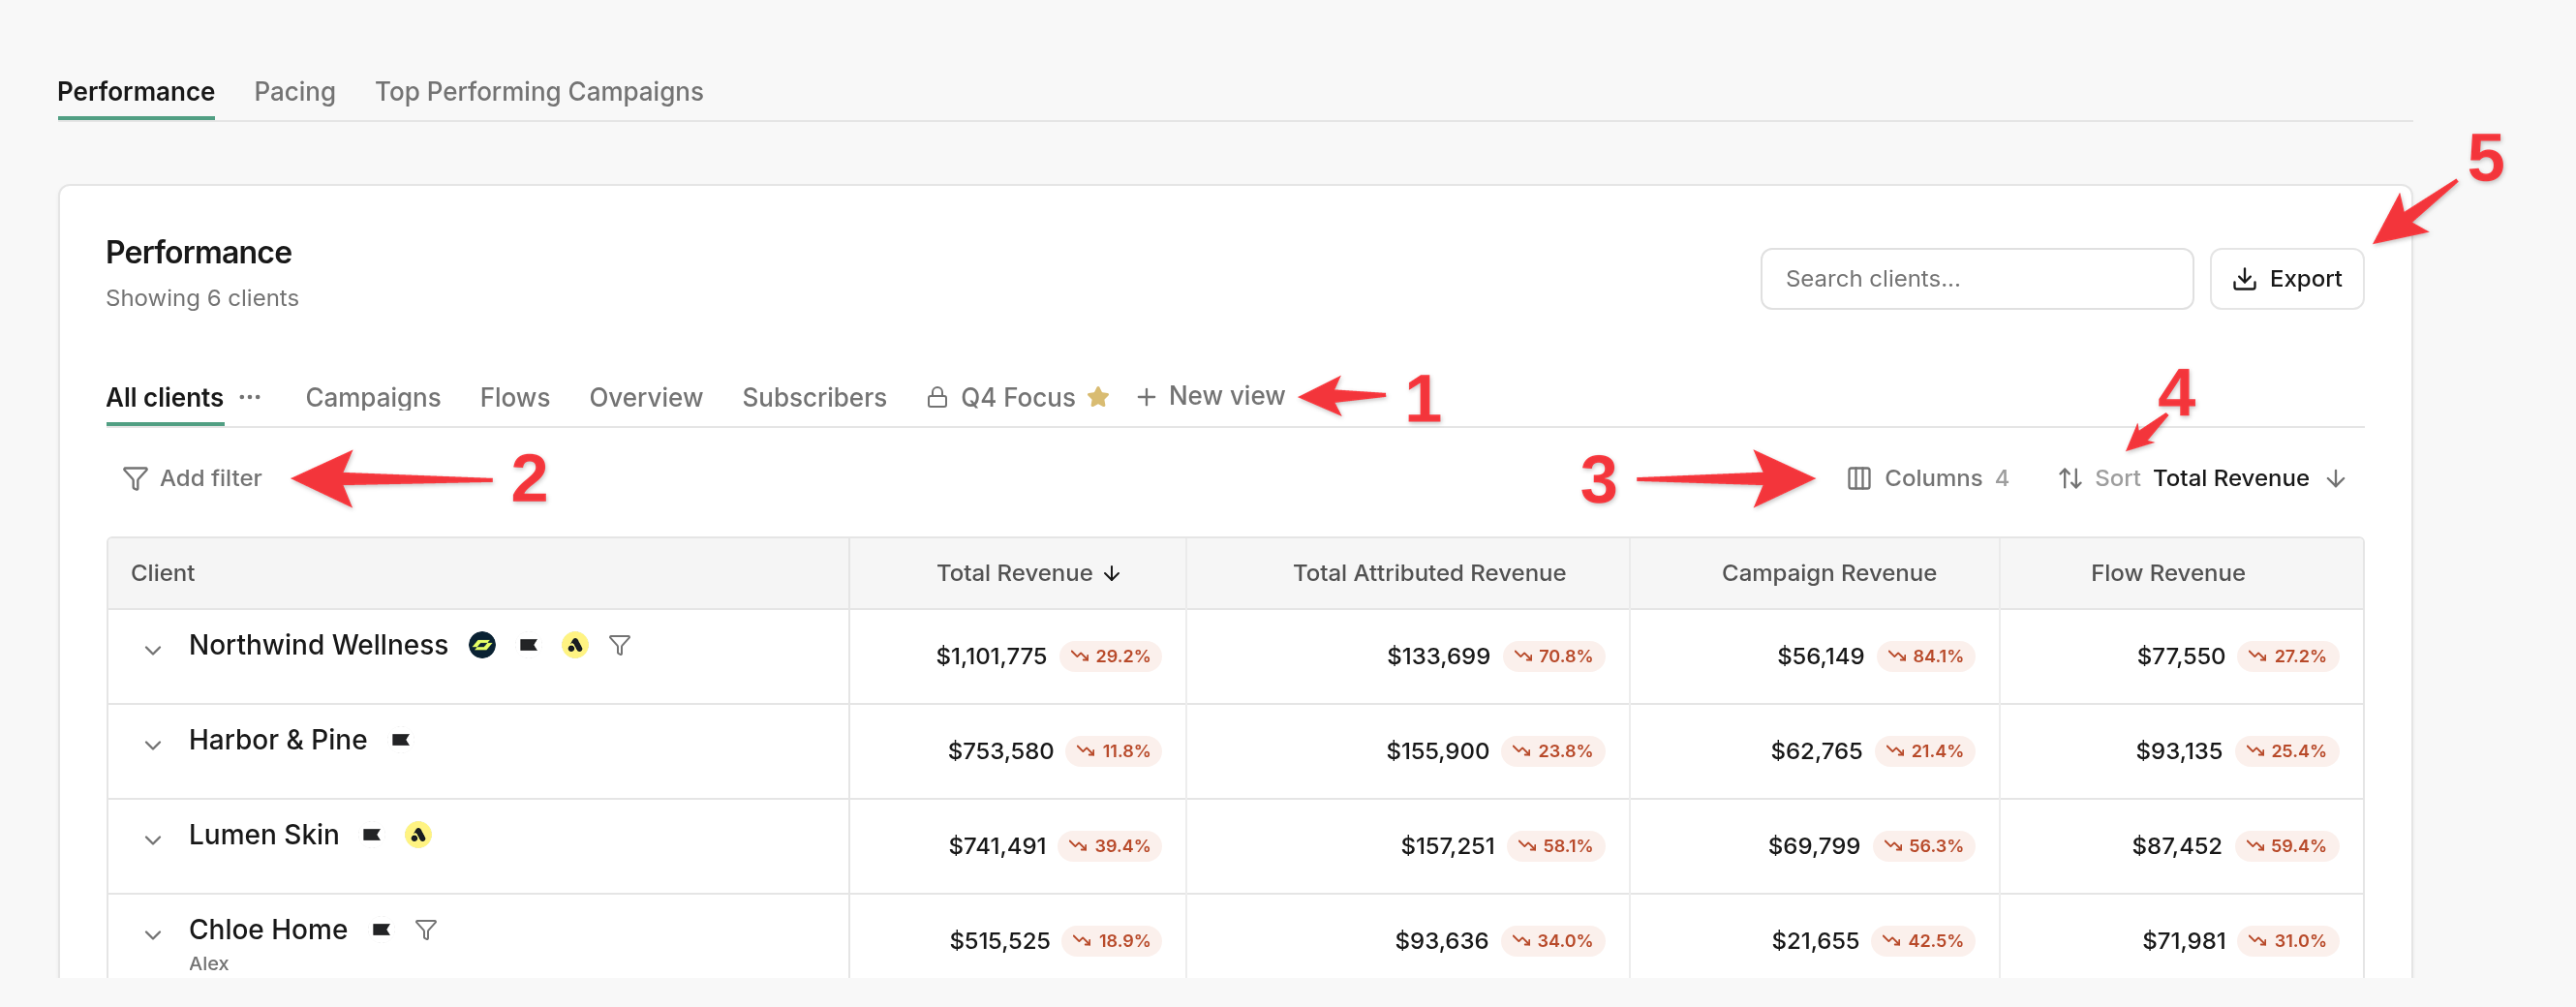
Start from All clients or a built-in view (Campaigns, Flows, Overview, Subscribers), or click New view.
Add filter to narrow the clients, for example Manager is to see only your own clients, or by tag.
Columns opens the full field list: tick the fields to show and drag them into order on the right.
Sort picks the column and order, or click a column header.
Export downloads the table as a CSV.
Save it with Save view or Save as new view, and choose Who can see it: Just me or My team. Use Set as my default in a view's ⋯ menu to open the page on it; a star marks your default and a lock marks a private view.
Pacing
Each client's attributed revenue so far this month, against the same point last year or last month.
YoY or MoM picks what each client is compared with.
Each bar is the client's month to date. The pin marks where the client was by this day last year or last month, and the end of the bar is that month's full total. Green is at or above pace, yellow is up to 10% behind, red is more than 10% behind.
Click Pacing Ahead, On Track or Behind in the Agency Snapshot to see just those clients here, grouped.
Search clients finds one client, and Export downloads the table as a CSV. Clients with no attributed revenue this month are hidden until you click Show … clients with no attributed revenue.
Top Performing Campaigns
The 100 campaigns that drove the most across all your clients in the date range, with each campaign's client, send date, recipients, open rate, click rate and revenue.
All channels narrows it to Email, SMS, WhatsApp or Push.
List shows a table: click Recipients, Open Rate, Click Rate or Revenue to sort by it.
Tiles shows each campaign with its creative. Pick what to sort by in the menu next to the channel filter.
Export downloads the campaigns as a CSV.
More about these numbers
Currency. When all your clients use the same currency, the Agency Snapshot shows its totals in that currency. When they use different currencies, it converts each client to US dollars at an approximate rate and shows the totals in USD. The table always shows each client in its own currency.
Each client's own settings. Revenue follows each client's attribution settings and order filters; a filter icon next to a client's name means it has revenue filters.