
Subscriber to First Purchase
The Subscriber to First Purchase page measures the very top of your customer journey: the step where a list subscriber becomes a first-time buyer. It groups subscribers into monthly cohorts by the month they joined your email or SMS list, then tracks how many of them placed a first order — and how quickly — within a 1, 3, 6, or 12-month window.
The page has two views that work together:
Subscriber to First Purchase Conversion is a snapshot for one subscribed range — how many prospects converted, how fast, and how much revenue those first orders drove.
Subscriber to First Purchase Over Time breaks that same conversion out by monthly cohort, so you can see whether newer subscriber groups are converting at a higher, lower, or about the same rate as earlier ones did at the same point in their lifecycle.
The throughline is the same as any cohort view — is the quality of the subscribers we're acquiring improving over time?
Subscriber to First Purchase Conversion
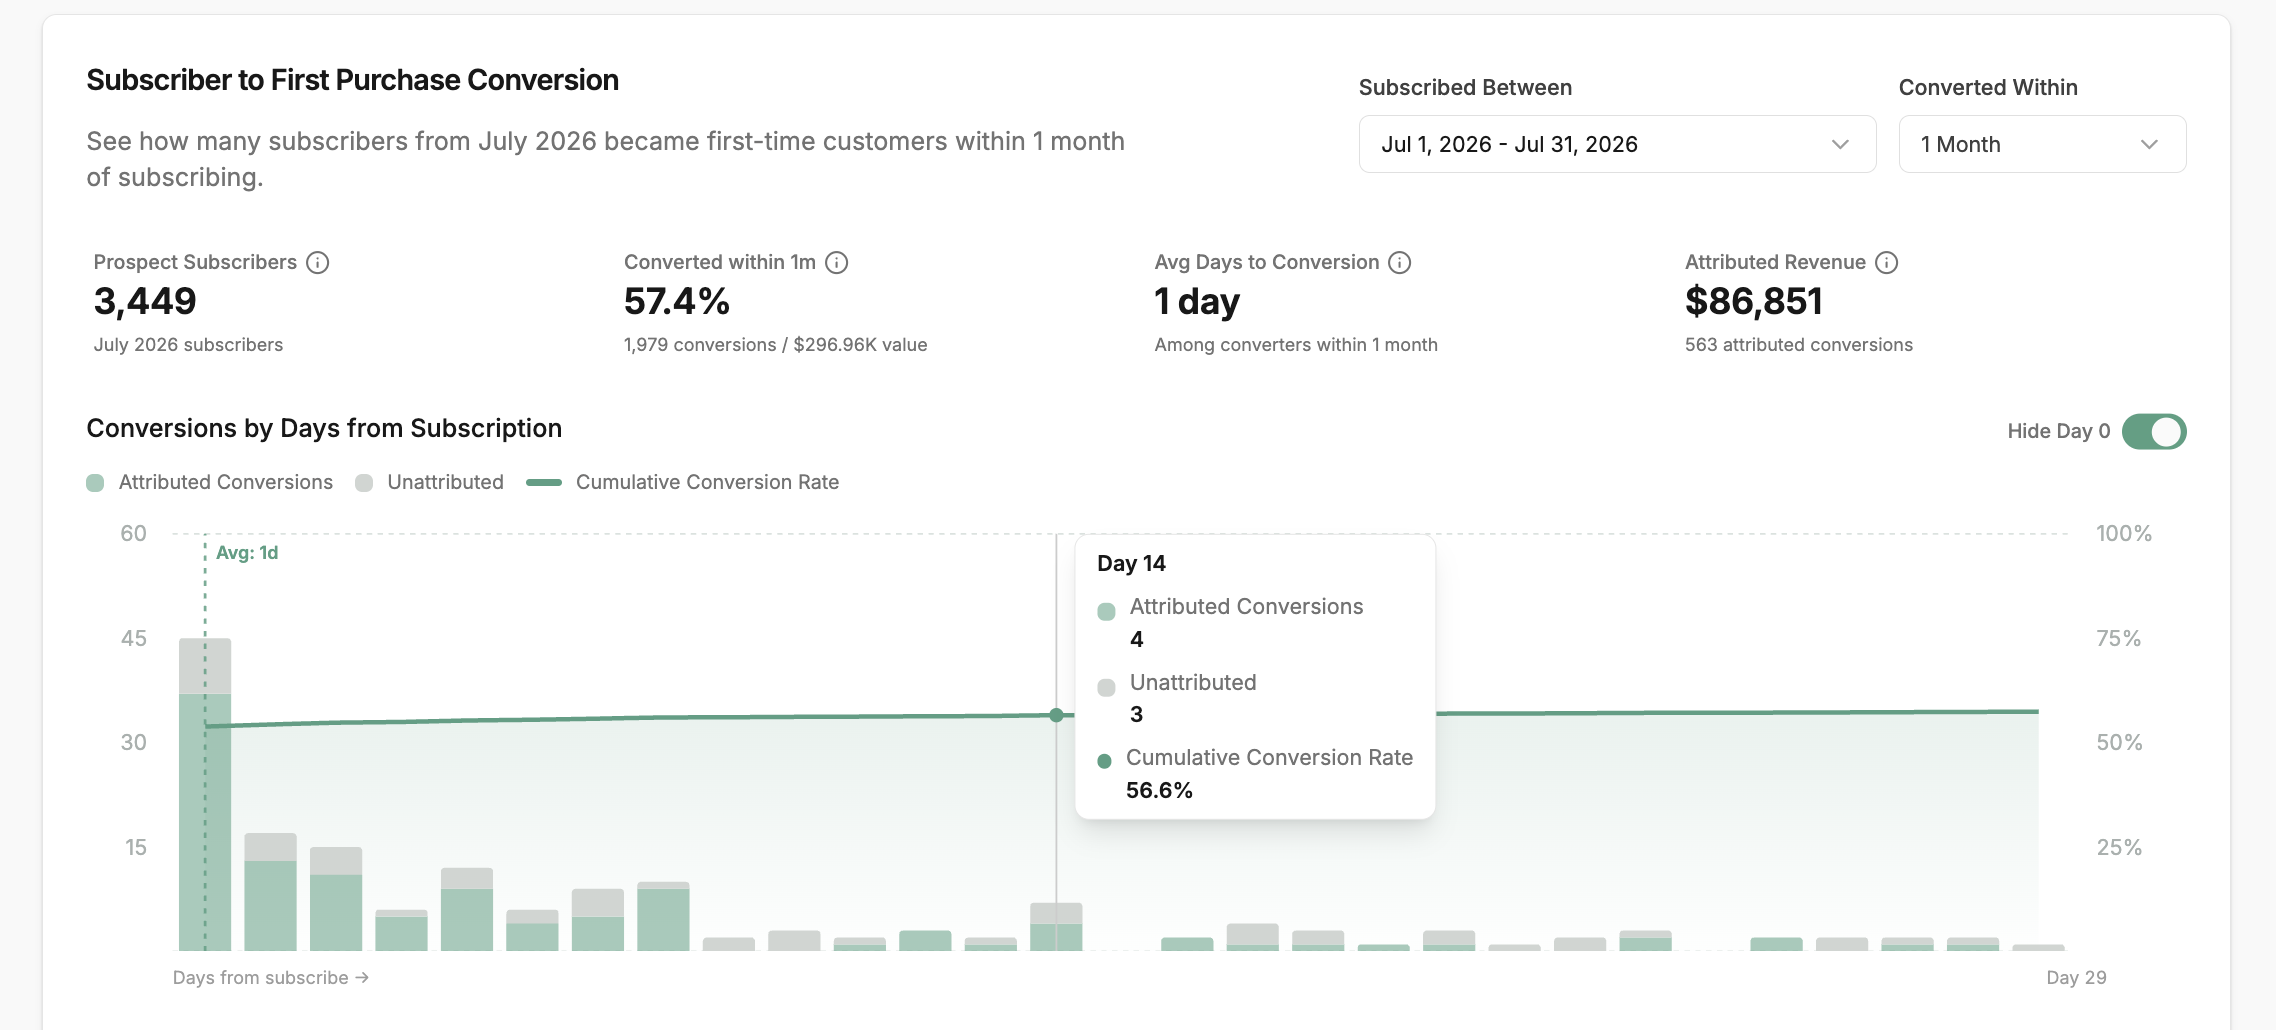
What you're looking at:
The cohort here is subscribers (people who joined your email/SMS list, and hadn't purchased before that subscribe event).
You pick a "Subscribed Between" range and a conversion window (1, 3, 6, or 12 months).
The card shows: how many prospects subscribed, what % converted to a first order within the window, the average days to convert, and the attributed revenue from those first orders.
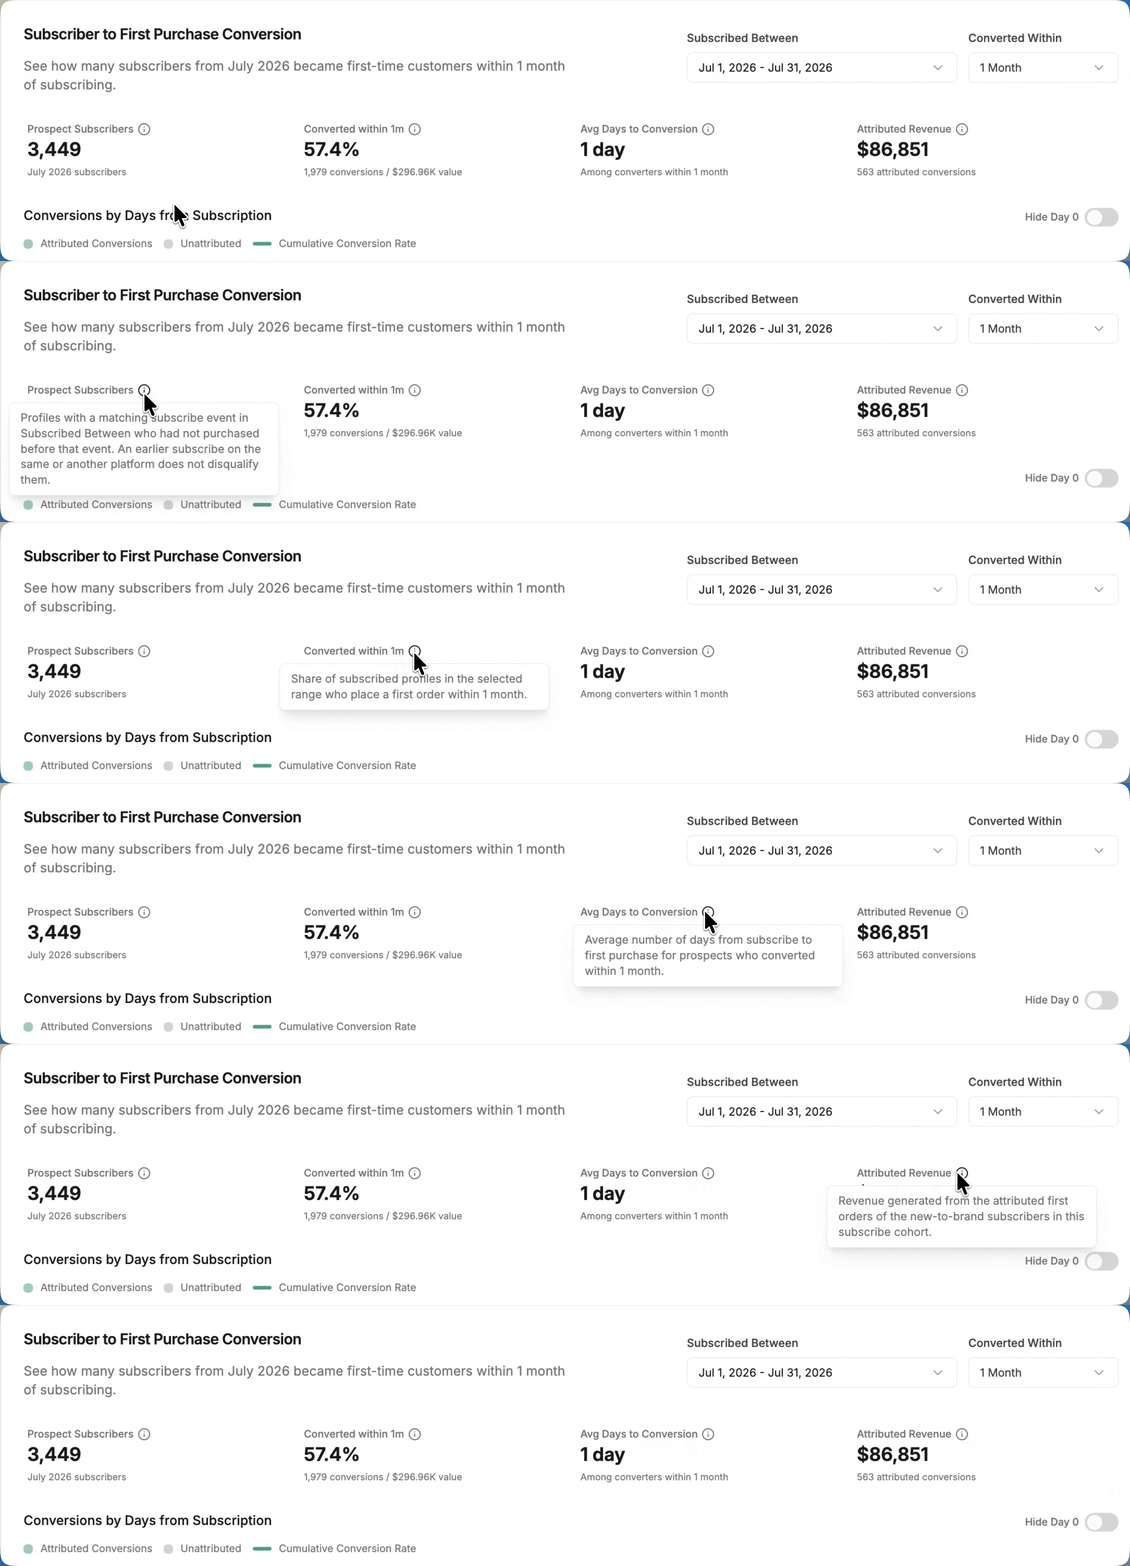
Hover over the ⓘ icons for definitions and details on how each metric is calculated.
How to read it:
The bars show how many subscribers made their first purchase on each day after subscribing. Green represents attributed conversions; gray represents unattributed conversions. The green line shows the cumulative conversion rate: the share of all prospect subscribers who had made a first purchase by that day.
In this example, 3,449 prospects subscribed in July. By Day 14, about 1,952 (56.6%) had made a first purchase. Seven purchased on Day 14—four attributed and three unattributed—so those seven are included in the cumulative total.
Within one month, 1,979 subscribers (57.4%) had made a first purchase. That rate includes both attributed and unattributed conversions. Of those conversions, 563 were attributed, accounting for $86,851 in attributed revenue.
Subscriber to First Purchase Over Time
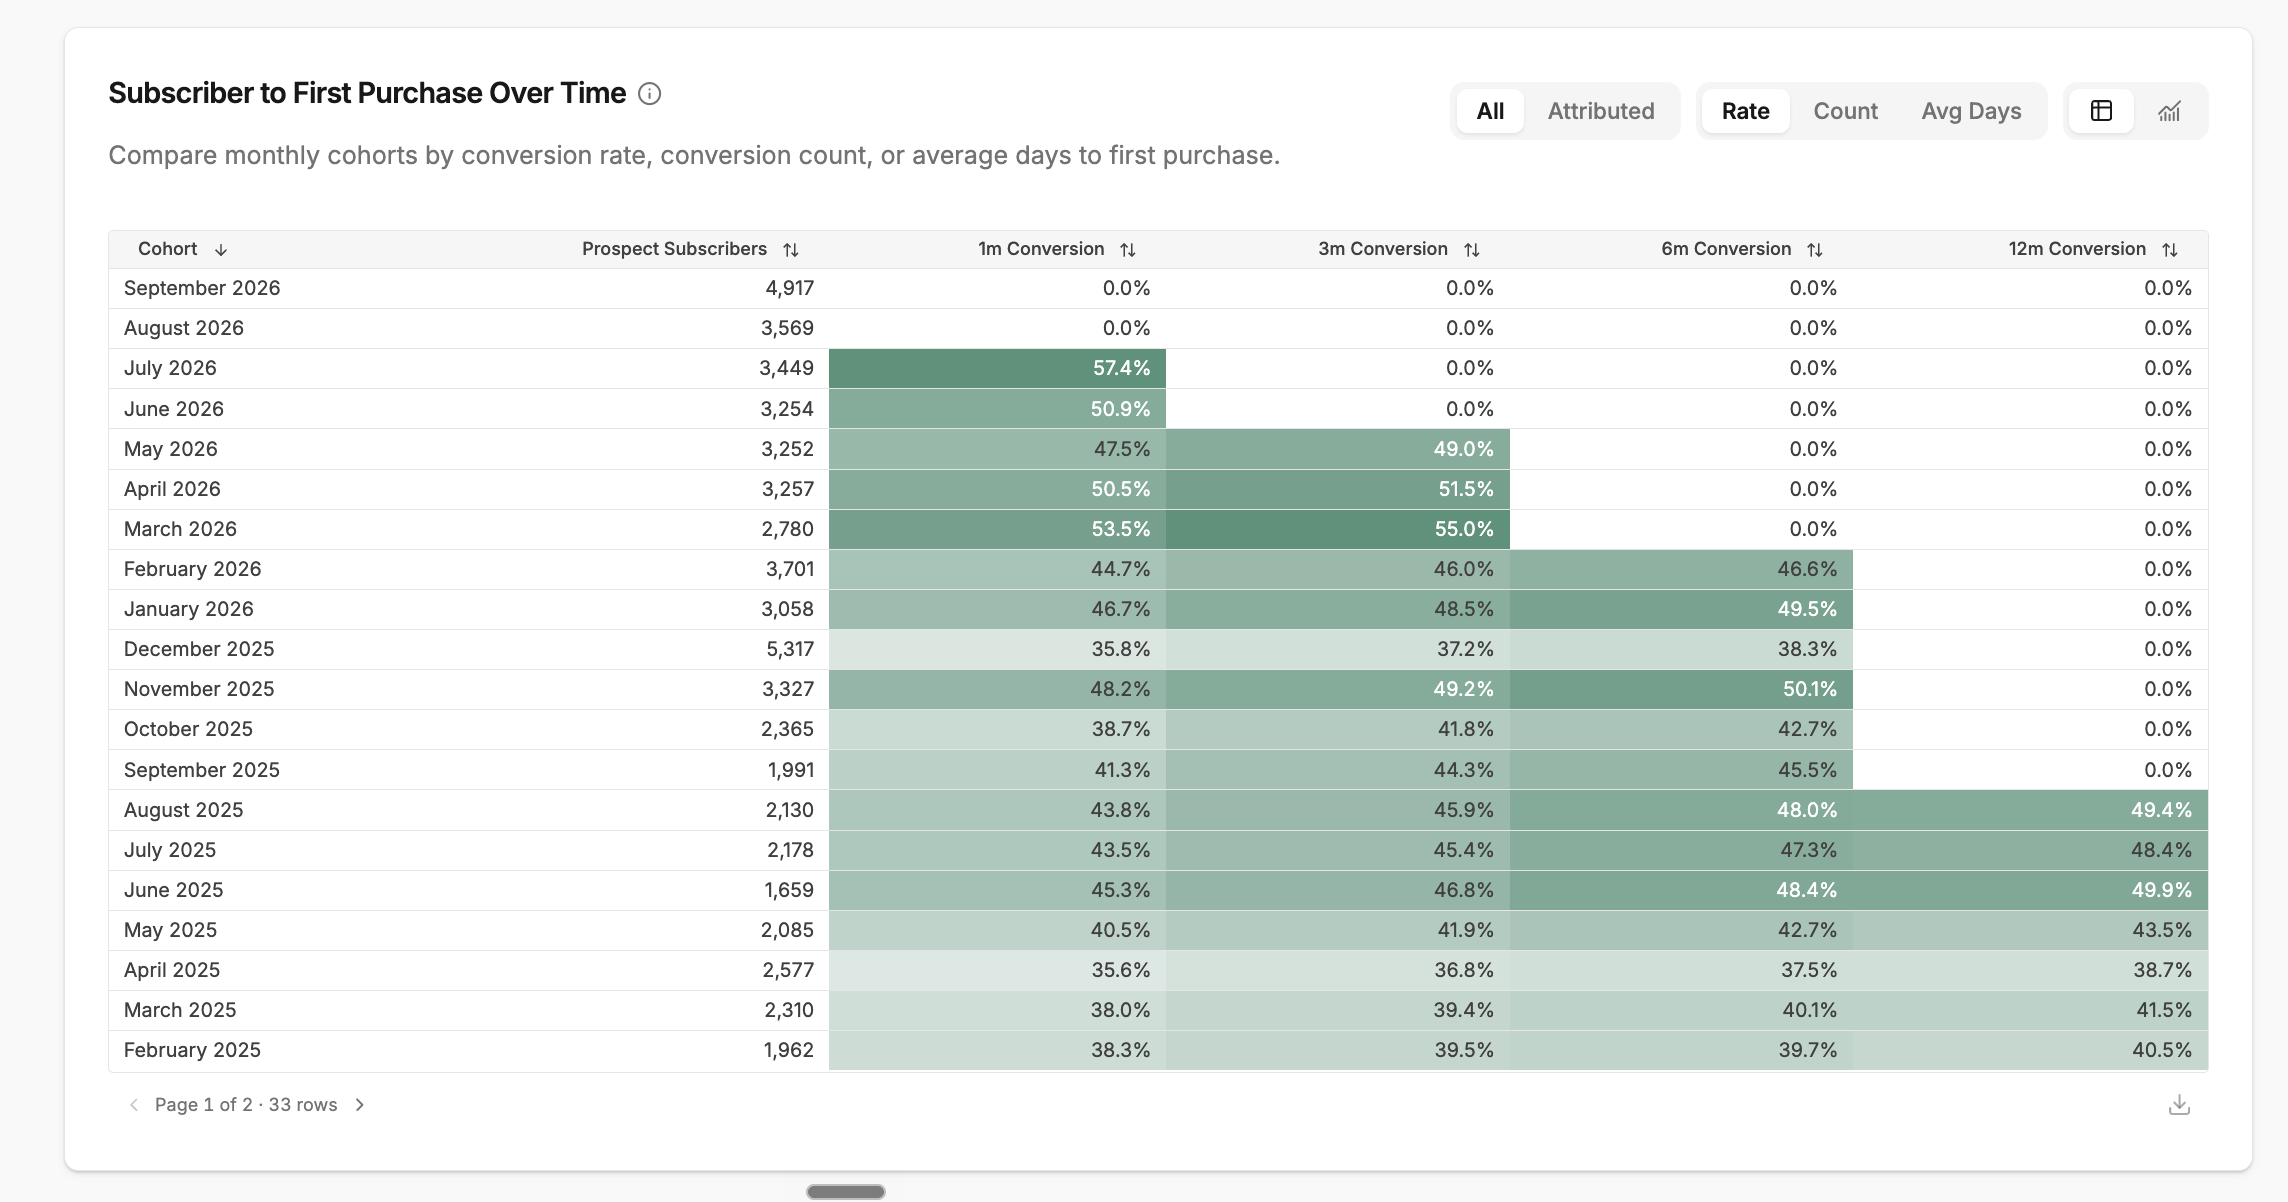
How to read the table
Each row is a monthly cohort of prospect subscribers: people who joined your email or SMS list that month and had not purchased before subscribing. “Prospect Subscribers” shows the size of that group.
The 1m, 3m, 6m, and 12m columns show the percentage of that cohort who made a first purchase within each window.
For example, of the 3,449 prospects who subscribed in July 2026, 57.4% purchased within one month. For the May 2026 cohort, 47.5% purchased within one month and 49.0% within three months. The darker the cell, the higher the rate.
Why recent cohorts have no results in longer windows
A cohort needs time to complete a conversion window before its result can be shown.
July 2026, for example, has a completed one-month result but has not yet completed its three-month window. Those unavailable cells are intentionally left without a result so an incomplete cohort isn’t compared with cohorts that have had the full time to convert.
Switch to the trend chart
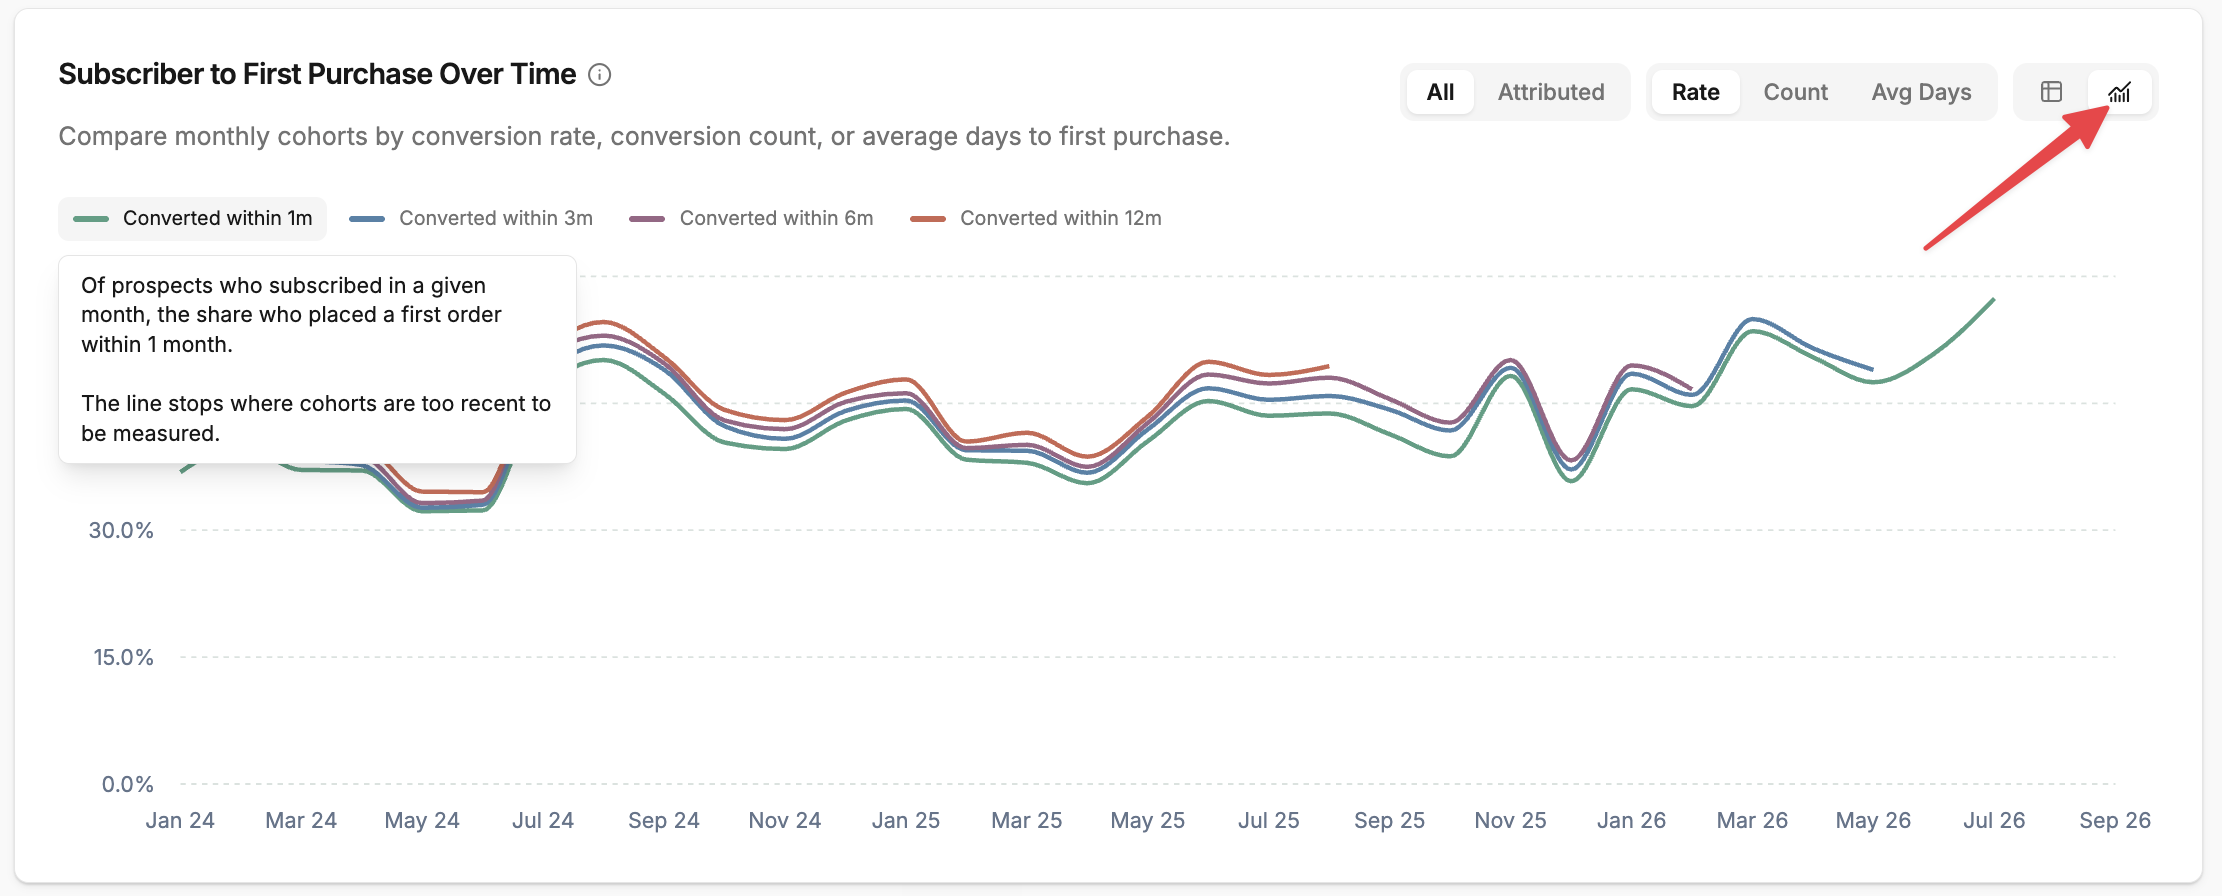
Select the chart icon to see how first-purchase conversion rates compare across monthly subscriber cohorts as lines.
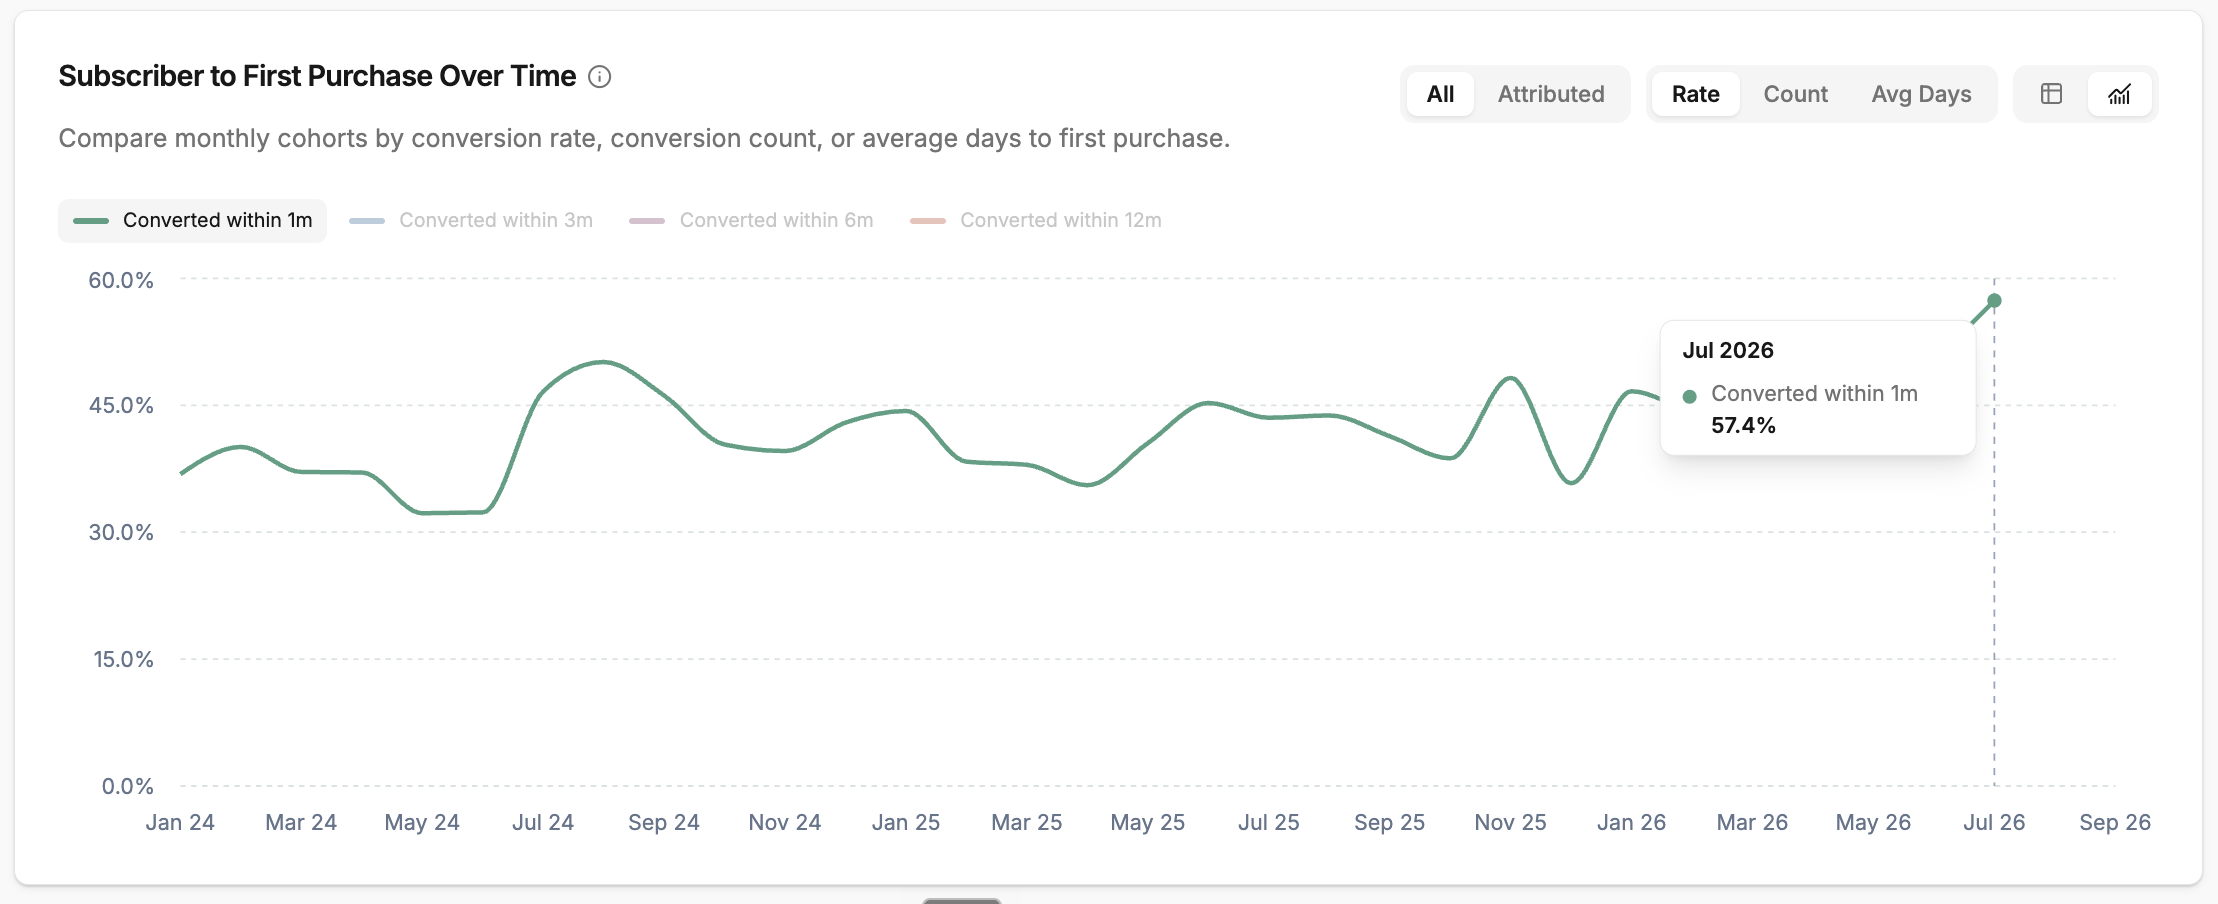
Use the All / Attributed control to choose which conversions to view, and Rate / Count / Avg Days to change the measure shown. This screenshot has All and Rate selected, so it includes both attributed and unattributed purchases and shows the percentage of each cohort that converted.
Each point on the horizontal axis represents the month people subscribed. The colored lines show what percentage of that month’s prospect subscribers made a first purchase within 1, 3, 6, or 12 months.
For example, the green point for July 2026 shows that 57.4% of July’s 3,449 prospect subscribers purchased within one month, same as the table view.
Follow one colored line to compare the same conversion window across different signup months. Compare the colored lines at a single month to see how that cohort’s conversion rate grows with more time to purchase.
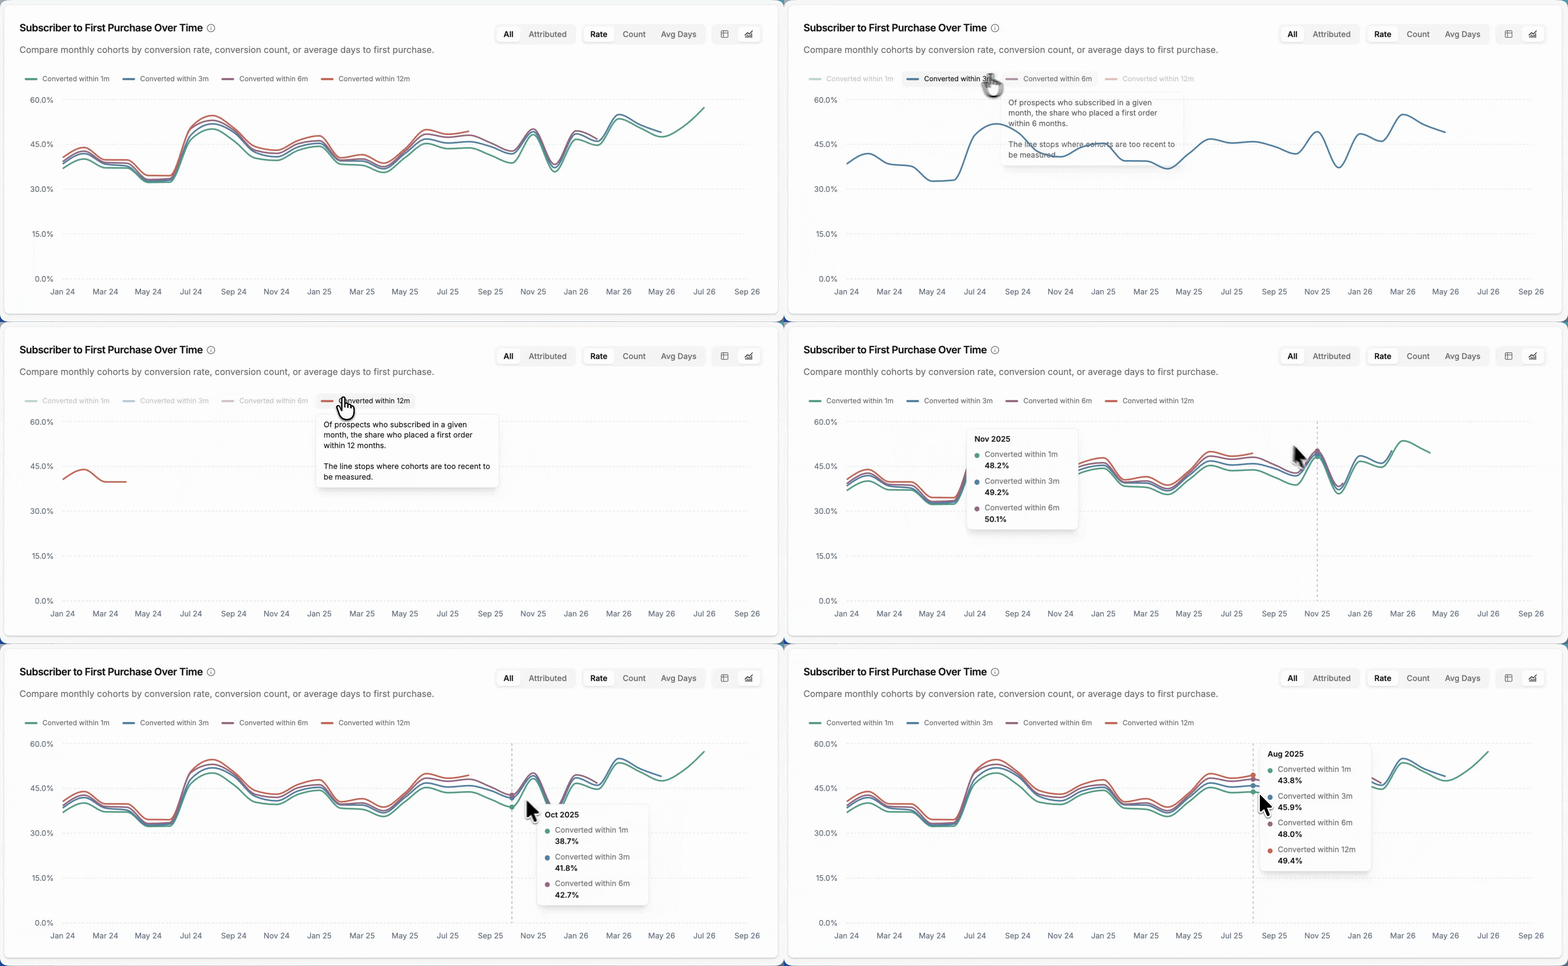
The longer-window lines stop earlier because recent cohorts haven’t had enough time to complete those windows.
Interpretation tips
Start with the one-month conversion rate across cohorts. This tells you what share of each month’s new subscribers made a first purchase soon after joining. If the rate changes, look for possible reasons: signup sources, seasonal promotions, welcome flow timing, and the offers in your first few messages. Compare the rate alongside cohort size so a change in subscriber volume doesn’t get mistaken for a change in conversion quality.
Then compare the one-month and three-month rates. If the one-month rate stays steady while the three-month rate rises for newer cohorts, more of those subscribers may be purchasing later. That’s a reason to review what happens after the welcome flow: are subscribers still hearing from you while they consider their first purchase? Compare only cohorts that have completed both windows.
Use the bars to find when purchases happen. The cumulative line shows the share that has purchased by each day, while the bars show purchases on each day. If purchases cluster early and then taper off, consider testing a follow-up after the initial welcome messages. If purchases continue later, review whether your ongoing email or SMS cadence supports that longer path to a first order. Check whether Day 0 is hidden when assessing the early pattern, and select a longer conversion window to inspect purchases beyond the first month.
Give recent cohorts time to mature. A recent cohort without a three-, six-, or twelve-month result has not completed that window yet. The trend-chart lines stop for the same reason. Compare cohorts using the same completed conversion window before deciding whether performance has changed.